本文共 10859 字,大约阅读时间需要 36 分钟。
2020 泰迪杯 C 题,含数据代码
思路
具体思路请见:
第一问
数据预处理
首先打开附件 2:

然后以留言详情为输入数据,以一级标签为输出标签,于是问题转换为一个文本分类的问题。因此,我们需要将非结构型文本数据转换为结构型文本数据(表格);将文本标签(一级标签)转换为自然数,以表示类别,如下所示:

二元语法
对于输入文本,首先用二元语法对文本进行拆分,如下所示:

词袋模型
进行二元语法拆分后,我们需要进行特征提取,将上述文本结构转换为结构化数据。我们将上述所有的数据的取值作为表头,每一条数据,在某一列的取值为,其对应的二元字符,出现的频次。
如第 0 条数据,列 “3区” 的取值 1;列“尊敬” 的取值为 0。不过,在实际编程上,可定不能直接用一个表格表示,因为转换后的数据必然是极其稀疏的稀疏表格。并且,直接用中文字符来作为列名,也十分浪费存储空间。本人曾经试过,若转换为稀疏表格,则将占用 40 GB… 而我的小电脑才 8 GB 内存呀…
于是这里用稀疏矩阵的方式来存储,比如将第一行存储为:
[(0, 1), (1, 1), (2, 1), (3, 1),... (90, 1), (91, 1), (92, 1)]第二行存储为:
[(7, 1),(26, 1),(73, 1),(77, 1),(93, 1),...(163, 1),(164, 1),(165, 1)]转换为稀疏矩阵后,由于输入特征的数量很多,容易造成维度灾难,所以需要采用一些过滤方法。这里采用卡方检测法:卡方检测法用于检测两个分布是否独立,我们可以遍历每一个输入特征,与标签做卡方检测,若证明独立,则可以排除掉当前特征。
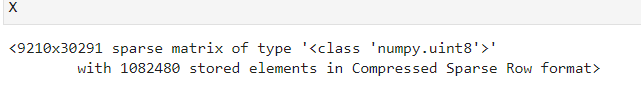
这里设置卡方检测的显著水平为 0.001,原假设为当前输入特征与标签是独立的。可得,那些保留下来的特征共 30291 个。
最后的出来的数据集为,一个 9210X30291 的稀疏矩阵:
分类模型
机器学习方法
根据“没有免费午餐定律”,我们首先从如下模型中筛选最佳模型:
| 算法 | 逻辑回归 | k近邻算法 | 朴素贝叶斯分类器 | 支持向量机分类 | 决策树 | 随机森林 | AdaBoost |
|---|---|---|---|---|---|---|---|
| 符号 | lg | knn | nb | svc | dtc | rf | ada |
但在此之前,先结合交叉验证,网格寻优寻找最合适参数,参数网格和筛选结果如下:(其中随机森林的基函数为最大深度为 5 的决策树; AdaBoost 的基模型为逻辑回归模型)

然后,在根据 5 折交叉验证,计算最合适参数下,各模型的 F1 如下:

从各模型的 F1 的均值可以剔除决策树、随机森林和 kNN。剩下的模型差别均不大。但是,人们不能贸然地认为这些模型在效果上是 等 价的。因此,为了判断这些模型是否等价,还需要采用 T 检验的方法。我们对上述保留下来的模型进行两两 T 检验:(原假设为均值相等)

可见,这些模型都是等价的。但由于 AdaBoost 耗费资源最多,训练时长过长,运行时间过长,不建议选用。
个人觉得,除了 AdaBoost 之外,其他模型的性能如下表:
| 模型 | 占用空间 | 训练时长 | 运行时间 |
|---|---|---|---|
| lg | *** | ** | ** |
| svc | *** | * | * |
| nb | * | ** | *** |
* 越多越好
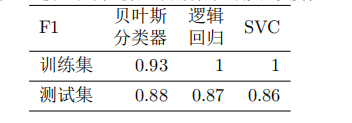
分别训练三个模型,并将数据集按 7:3 拆分为训练集、测试集,测出模型在训练集、测试集中的 F1 值如下所示:
多层感知器
模型
因为我们将分类标签视为 0/1/2 等自然数,所以这里可将分类问题看成一个回归问题。(这也是一种解题思路吧,其实就是本人太懒了…)
当然,如果你想要按分类问题来做,那么利用深度学习的方法的话,你就必须进行 one-hot 编码了!
设置网络的拓扑结构如下:

训练算法为:Adam; 评价指标为:均方误差(MSE);损失函数也是均方误差。同时,对每一层隐藏层加上一个 dropout 率为 0.1 的 Dropout 正则化。
结果
第二问
数据预处理
要从每一个群众的留言中,收集某一时间段内群众集中反映的问题,显然属于一个文本聚类的问题。如果将群众相似的留言聚成一簇,即可将簇视为某个集中问题。根据该簇包含的留言条数、支持和反对的总数,并考虑其热度随时间的衰减,即可估计该问题的热度。
为了提取出聚类簇中留言的问题描述,以及地点和人群。这里考虑使用关键语句提取算法,从而自动生成关键句,再从关键句中人工提取出地点和人群。籍此就可以降低直接从留言详情中,人工提取问题概述的工作量。
分词
首先,我们用一个条件随机场来分词。当然,条件随机场是一个序列标注模型,属于机器学习的一部分。为了训练一个条件随机场的分词模型,我们用了开源的分词数据集 MSR,最后训练出以条件随机场分词模型。
以附件 3 的第一条为例,用条件随机场分词结果如下:
[座落, 在, A市, A, 3区联丰路米兰春天G2栋320, ,, 一家, 名, 叫, 一米, 阳光, 婚纱, 艺术, 摄影, 的, 影楼, ,, 据说, 年单, 这, 一个, 工作, 室, 营业额, 就, 上百万, ,, 因为, 地处, 居民, 楼, 内部, ,, 而且, 有, 蛮长, 的, 时间, 了, ,, 请, 税务局, 和, 工商局, 查, 一下, ,, 看看, 这个, 一米, 阳光, 有没有, 正常, 纳税, !, 如果, 没有, ,, 应该, 会, 怎么, 操作, !]停用词过滤
采用双向匹配法,运用 hanlp 自带的停用词字典,过滤掉那些没有意义的词和符号:
['座落', 'A市', 'A', '3区联丰路米兰春天G2栋320', '一家', '一米', '阳光', '婚纱', '艺术', '摄影', '影楼', '据说', '年单', '工作', '室', '营业额', '上百万', '地处', '居民', '楼', '内部', '蛮长', '时间', '请', '税务局', '工商局', '查', '看看', '一米', '阳光', '有没有', '正常', '纳税', '没有', '应该', '会', '操作']词袋模型
和第一问一样,我们依旧是用词的频次作为每一个特征的取值,以第一条为例,其值为:
{0: 1, 1: 1, 2: 1,... 32: 1, 33: 1, 34: 2}第二条其值为:
{1: 3, 2: 1, 6: 1, 15: 1, 26: 1,... 76: 1, 77: 2, 78: 2}词袋模型有很多,除了单纯地使用频次外,还有使用 TF-IDF 的,但是使用 TF-IDF,会破坏数据的稀疏性,从而导致无法处理,所以这里只能采用频次,但没关系,能够用就可以。
PCA 降维
数据的特征个数,经过分词、停用词过滤、词袋模型之后,共有 42754 个。我们将其降低至 1000 个,同时计算其贡献和累计贡献,图如下:


热度挖掘
本文定义:话题热度 = 话题留言数 + 点赞数 - 0.5 反对数;且热度随着时间的延迟而呈现指数下降。
话题——聚类
什么是话题?每条留言的背后都是一个话题,于是,肯定有些留言的话题是相似的,相同的。为了找出话题,我们可以采用聚类的方法。
注意:聚类并不能找出语义的相似,而是找出“表面”的相似,比如:
我是慢热的人和他是慢热的人可能属于一类,但我是慢热的人和我是内向的人却不是同一类,即使后者语义更加相近,反应的更近似于同一个主题。
但是,为了让大家学习,我们这里采用聚类。在第三问,还有求相似度的。到了那里,我们再用其他方法好不?
其实这里主要是为了让大家学习啦。不然我第一问就用分词的方法了,何必再重复呢?希望大家能学到更多的东西,如果觉得这篇文章对你们有所帮助,请点赞咯~
如何聚类呢?这里采用 DBSCAN。
聚类结果如下:
{-1: 3629, 0: 3, 1: 2, 2: 227, 3: 2, 4: 3, 5: 2, 6: 2, 7: 2, 8: 2, 9: 2, 10: 3, 11: 2, 12: 2, 13: 2, 14: 2, 15: 3, 16: 4, 17: 2, 18: 2, 19: 2, 20: 2, 21: 2, 22: 2, 23: 3, 24: 3, 25: 3, 26: 3, 27: 2, 28: 2, 29: 2, 30: 2, 31: 2, 32: 2, 33: 2, 34: 2, 35: 3, 36: 2, 37: 2, 38: 2, 39: 2, 40: 2, 41: 4, 42: 2, 43: 3, 44: 3, 45: 2, 46: 3, 47: 5, 48: 3, 49: 3, 50: 2, 51: 2, 52: 2, 53: 2, 54: 2, 55: 2, 56: 3, 57: 3, 58: 3, 59: 2, 60: 4, 61: 2, 62: 2, 63: 2, 64: 2, 65: 2, 66: 2, 67: 2, 68: 3, 69: 4, 70: 2, 71: 2, 72: 2, 73: 2, 74: 2, 75: 2, 76: 2, 77: 3, 78: 4, 79: 2, 80: 2, 81: 2, 82: 2, 83: 2, 84: 3, 85: 2, 86: 2, 87: 2, 88: 2, 89: 2, 90: 2, 91: 2, 92: 3, 93: 2, 94: 2, 95: 2, 96: 2, 97: 2, 98: 2, 99: 2, 100: 2, 101: 2, 102: 2, 103: 2, 104: 2, 105: 2, 106: 2, 107: 2, 108: 2, 109: 3, 110: 2, 111: 2, 112: 2, 113: 2, 114: 2, 115: 2, 116: 2, 117: 2, 118: 2, 119: 2, 120: 2, 121: 2, 122: 2, 123: 2, 124: 2, 125: 2, 126: 2, 127: 2, 128: 2, 129: 3, 130: 2, 131: 2, 132: 2, 133: 2, 134: 2, 135: 2, 136: 2, 137: 2, 138: 2, 139: 2, 140: 2, 141: 4, 142: 2, 143: 2, 144: 2, 145: 2, 146: 2, 147: 2, 148: 3, 149: 3, 150: 2, 151: 3, 152: 2, 153: 2, 154: 2, 155: 2, 156: 2, 157: 2, 158: 2, 159: 2, 160: 5, 161: 2, 162: 2, 163: 2, 164: 2, 165: 2, 166: 3, 167: 2, 168: 2, 169: 2, 170: 3, 171: 2, 172: 2, 173: 2, 174: 2, 175: 2, 176: 2, 177: 2, 178: 2, 179: 2, 180: 2, 181: 2, 182: 2, 183: 2, 184: 3, 185: 2, 186: 2, 187: 2, 188: 2, 189: 2, 190: 2, 191: 2, 192: 2, 193: 2, 194: 2, 195: 2, 196: 2, 197: 2, 198: 2, 199: 2, 200: 2, 201: 2, 202: 3, 203: 4, 204: 2, 205: 2, 206: 2, 207: 2, 208: 2, 209: 2, 210: 2}其中 -1 为游离个体。
我们把一个簇叫做一个话题。我们得出每一个话题的热点计算公式如下:
{ y i = 10 + Y − 0.5 N + Δ y i y i > 0 0 y i ≤ 0 \left\{\begin{array}{ll} y_{i}=10+Y-0.5 N+\Delta y_{i} & y_{i}>0 \\ 0 & y_{i} \leq 0 \end{array}\right. { yi=10+Y−0.5N+Δyi0yi>0yi≤0
Δ y i \Delta y_i Δyi 为时间衰退。按一般观点,热度的衰退应该是呈现指数型的,所以我们将 Δ y i \Delta y_i Δyi 定义为如下格式:
− Δ y = a exp ( b Δ t ) − c -\Delta y=a \exp (b \Delta t)-c −Δy=aexp(bΔt)−c
那么定义上述的参数呢?观察数据可以发现,最近的留言时间为 T=2020-1-26 19:47:11;最远的留言时间为:2017-6-8 17:31:20,时间间隔为 962 天。
挖掘所有课题,发现 10 + Y − 0.5 N 10 + Y - 0.5N 10+Y−0.5N 取值最大为 2107。因此,我们定义:经过 962 天后,热度应下降 2107。经过 962 / 2 962/2 962/2 天后,关注度下降 2107 / 16 2107/16 2107/16,据此可列出方程为:
{ a exp ( 0 ) − c = 0 a exp ( 962 2 b ) − c = 2107 / 16 a exp ( 962 b ) − c = 2107 \left\{\begin{array}{l} a \exp (0)-c=0 \\ a \exp \left(\frac{962}{2} b\right)-c=2107 / 16 \\ a \exp (962 b)-c=2107 \end{array}\right. ⎩⎨⎧aexp(0)−c=0aexp(2962b)−c=2107/16aexp(962b)−c=2107
于是热度下降函数为:
− Δ y = 262.125 exp ( 0.0023 Δ t ) − 262.125 -\Delta y=262.125 \exp (0.0023 \Delta t)-262.125 −Δy=262.125exp(0.0023Δt)−262.125
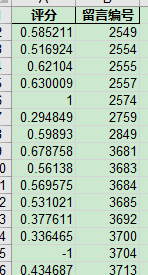
可得热度结果如下:

最后得出前 10 热点问题的所有留言如下:

热点描述
这里模仿 google 的 pagerank 算法提出一种 textrank 算法(前人做的)。对于 pagerank,我们将网页视为节点,节点的分数决定了其热度。设节点 V i V_i Vi 的分数为 S ( V i ) S(V_i) S(Vi),设节点 V i , V j V_i,V_j Vi,Vj 存在有向边,则:
S ( V i ) = ( 1 − d ) + d × ∑ V j ∈ In ( V i ) 1 ∣ O u t ( V j ) ∣ S ( V j ) S\left(V_{i}\right)=(1-d)+d \times \sum_{V_{j} \in \operatorname{In}\left(\mathrm{V}_{\mathrm{i}}\right)} \frac{1}{\left|\mathrm{Out}\left(\mathrm{V}_{\mathrm{j}}\right)\right|} S\left(V_{j}\right) S(Vi)=(1−d)+d×Vj∈In(Vi)∑∣Out(Vj)∣1S(Vj)
S ( V ) S(V) S(V)的初始化为 1,KaTeX parse error: Can't use function '\]' in math mode at position 9: d\in(0,1\̲]̲ 是一个常数因子,模拟用户点击网页 V i V_i Vi 的概率。 O u t ( V j ) Out(V_j) Out(Vj) 表示从 V j V_j Vj出发链接到的节点的所有节点。
将 pagerank 推广到关键句识别中。以句子为节点,设每条句子两两都存在链接,并记 d d d 为当前句子和其他所有句子之间的平均“间隔”,即处于中心的句子, d d d 越大。
由于所有句子都存在链接,所以上述公式不能用了。
因此,这是因为 ∣ O u t ( V j ) ∣ |Out(V_j)| ∣Out(Vj)∣ 都相同。因此这里定义两条句子的相似度如下:
B M 25 ( V i , V j ) = ∑ k = 1 n I D F ( term k ) T F ( term k , V i ) ( α + 1 ) T F ( term k , V i ) + α ( 1 − β + β ∣ V i ∣ D L ) \begin{array}{r} B M 25\left(V_{i}, V_{j}\right)=\sum_{k=1}^{n} I D F\left(\text { term }_{k}\right) \frac{T F\left(\operatorname{term}_{k}, V_{i}\right)(\alpha+1)}{T F\left(\operatorname{term}_{k}, V_{i}\right)+\alpha\left(1-\beta+\beta \frac{\left|V_{i}\right|}{D L}\right)} \end{array} BM25(Vi,Vj)=∑k=1nIDF( term k)TF(termk,Vi)+α(1−β+βDL∣Vi∣)TF(termk,Vi)(α+1)
其中 α , β = 1 \alpha, \beta=1 α,β=1, ∣ V i ∣ |V_i| ∣Vi∣ 为句子 V i V_i Vi 的单词量, T F ( t e r m k , V i ) TF(term_k, V_i) TF(termk,Vi) 为单词 t e r m k term_k termk 在句子 V i V_i Vi 中的词频。 D F DF DF 为所有句子构成的合成文档中,每一条句子的平均词量,IDF 为逆文本频率,计算公式如下:
I D F ( term k ) = log ( S D F + 1 ) I D F\left(\text { term }_{k}\right)=\log \left(\frac{S}{D F+1}\right) IDF( term k)=log(DF+1S)
这里的 D F DF DF 为合成文档中,包含单词 t e r m k term_k termk 的句子数, S S S为合成文档中,句子的总数。于是,仿照 pagerank,可得句子的分数如下:
S ( V i ) = ( 1 − d ) + d × ∑ V j ∈ In ( V i ) B M 25 ( V i , V j ) ∑ V k ∈ Out ( V j ) B M 25 ( V i , V k ) S ( V j ) \begin{array}{l} S\left(V_{i}\right)=(1-d)+ d \times \sum_{V_{j} \in \operatorname{In}\left(V_{\mathrm{i}}\right)} \frac{B M 25\left(V_{i}, V_{j}\right)}{\sum_{V_{k} \in \operatorname{Out}\left(\mathrm{V}_{\mathrm{j}}\right)} B M 25\left(V_{i}, V_{k}\right)} S\left(V_{j}\right) \end{array} S(Vi)=(1−d)+d×∑Vj∈In(Vi)∑Vk∈Out(Vj)BM25(Vi,Vk)BM25(Vi,Vj)S(Vj)
我们将属于前 10 热度的,同一个话题的所有问题的详细描述,合成一个文档。之后,计算每一条句子的得分,最终找出得分最多的前三条句子作为关键句,即可得出问题描述。
对于时间范围,我们将同一话题的所有问题数据的时间,的最近、最远时间构成时间范围即可。
至于地点和人群…,自己找吧 😂

第三问
答复相关性
词向量
首先用关键句提取算法,从留言和答复中提取出三条关键句,之后比较这三条关键句的相关性即可。至于如何比较相关性,我们采用词向量的方法。
什么是词向量呢?词向量是一个单词的上下文。意义相似的词语,其上下文也是相似的。根据这一点,每个词语都存在一
个上下文词向量与之对应,使得统计模型能够根据该单词的词向量,预测到该单词。
- 上下文向量:
- “第八届 泰迪杯 建模 挑战 赛” , 则 单 词 “建模”的 上下文向量为[第八届, 泰迪杯, 挑战,赛]。当然,所谓上下文向量也是有长度限制的。如果语料库太长,很显然将所有的单词作为上下文是不可行的。这是就需要定义一个窗口,使得以本单词为中心的,左右有限宽度的单词,才构成上下文向量。 one-hot 编码法:
- 使 用 one-hot 编 码 法, 可 转 换 为 x = [ [ 1 , 0 , 0 , 0 , 0 ] T , [ 0 , 1 , 0 , 0 , 0 ] T , [ 0 , 0 , 0 , 1 , 0 ] T , [ 0 , 0 , 0 , 0 , 1 ] T ] x =[[1, 0, 0, 0, 0]^T , [0, 1, 0, 0, 0]^T , [0, 0, 0, 1, 0]^T, [0, 0, 0, 0, 1]^T] x=[[1,0,0,0,0]T,[0,1,0,0,0]T,[0,0,0,1,0]T,[0,0,0,0,1]T],并与单词 “建模”的 one-hot 编码 y = [ 0 , 0 , 1 , 0 , 0 ] T y = [0, 0, 1, 0, 0]^T y=[0,0,1,0,0]T对应。 CBOW 模型 :
- 上一小节我们知道,语料库每一个单词的 onehot 向量 y i y_i yi,都对应一个或多个上下文向量 x i x_i xi。因此,若以 x i x_i xi 为输入,以 y i y_i yi 为输出,就可以训练一个深度学习模型了,其中比较著名的就有 CBOW 模型。CBOW 模型实际上是一个三层的神经网络模型:
- 其中 x i , i ∈ { 1 , 2 , ⋅ ⋅ ⋅ , C } x_i, i\in\{1, 2, · · · , C\} xi,i∈{ 1,2,⋅⋅⋅,C} 为单词 one-hot 编码后的列向量, C C C 取决于窗口的大小。设窗口大小为 m m m, 则 C = 2 m 2m 2m。矩阵 W ∈ R n × ∣ V ∣ W \in R^{n×|V }| W∈Rn×∣V∣ 为 CBOW 网络的输入层到隐藏层的权重矩阵, W ′ ∈ R ∣ V ∣ × n W^\prime \in R^{|V |×n} W′∈R∣V∣×n 为隐藏层到输出层的权重矩阵。其中 n n n 为隐藏层的节点数。 ∣ V ∣ |V| ∣V∣ 为语料库中单词“种”数。 W W W 的第 i i i 个列向量为语料库中第 i i i 个单词的输入词向量,记为 w i w_i wi;类似地, W ′ W^\prime W′ 中第 j j j 个行向量为第 j j j 个单词的输出词向量,记为 w j ′ w^\prime_j wj′。由于输入词向量离输入层近,所以在应用中,一般抛弃输出词向量,将 输入词向量作为单词的词向量模块使用。

因此,要求出每一个单词的词向量,求出 CBOW 模型的参数是关键。本质上,CBOW 模型也是一个机器学习模型。设 COW 模型的预测为 y ^ \hat{y} y^,定义损失函数如下:
H ( y ^ , y ) = − ∑ j = 1 ∣ V ∣ y i log y ^ H(\hat{y},y)=-\sum_{j=1}^{|V|}y_i \log{\hat{y}} H(y^,y)=−j=1∑∣V∣yilogy^
这里,我们还是使用 SHANG05 的开源语料库 MSR 作为训练集。训练出一个隐藏层节点为 100 的 CBOW 模型,从而得出每一个单词的词向量。
相似度计算
首先对于留言和答复,分别提取出 5 条关键句。然后,计算这 5 vs 5 的两两句的最大相关性作为最终的相关性。
那么,如何计算两句的相关性呢?首先对句中的每一个词,他们的词向量取平均,从而得到一个稠密向量 s i s_i si ,对于另一句也一样,得出 s j s_j sj,然后计算两个向量夹角的余弦值,作为两句的相似度,如下所示:
cos θ = s i ⋅ s j ∣ s i ∣ × ∣ s j ∣ \cos \theta=\frac{\boldsymbol{s}_{i} \cdot \boldsymbol{s}_{j}}{\left|\boldsymbol{s}_{i}\right| \times | \boldsymbol{s}_{j} \mid} cosθ=∣si∣×∣sj∣si⋅sj
最后得出的结果如下:
答复完整性(代码没有实现)
本人理解的答复完整性,指的是语句是否通顺(可能有些歧义,因此本人就不实现了)。但句子是否通顺,似乎也带有非常大的主观性。因此,本人采用一种类似于局部完整性的方法去评价,句子的通顺性,具体如下:
为了评价答复的完整性与可理解性,本文将以相邻两个汉字为单位,逐一扫描留言答复。并匹配当前扫面是否存在于二元语法字典中,从而判断留言的局部完整性,和可理解性。计算公式如下:
C = 1 − N n o / L C = 1-N_{no}/L C=1−Nno/L
其中 N n o N_{no} Nno 为无法匹配的,句子中的二元对。 L L L 为句子中二元对的数量。
代码和数据
(关注一下呗 😁)代码和文档:https://gitee.com/zhuowoodbird/teddy_cup_C_2020
什么大佬好话就别说了,记得一键三连就可以了,咱们别做伸手党哈… 博主这厢有礼
很想写 2021 的泰迪杯 C 题,但怕呀… 所以希望这篇文章的解题代码和思路,能够为大家有一些参考作用吧
若果大家觉得这篇文章对大家有帮助,请不要吝啬您的点赞 😊
这个字典 HanLP 有自带的
转载地址:http://zhsg.baihongyu.com/